For a Windows executable exploratory data analysis project using IDA Pro I needed to display some graphs. As is my usual planed on doing this from a Windows IDA C/C++ plug-in.
I looked at doing this several ways. One idea was to just dump out a text file in the Graphviz DOT language and using a Graphviz viewer to see it. Couldn’t be much simpler than that, but then looking for possible Qt options I ran into the awesome QCustomPlot.
With a little work I got it going in IDA:
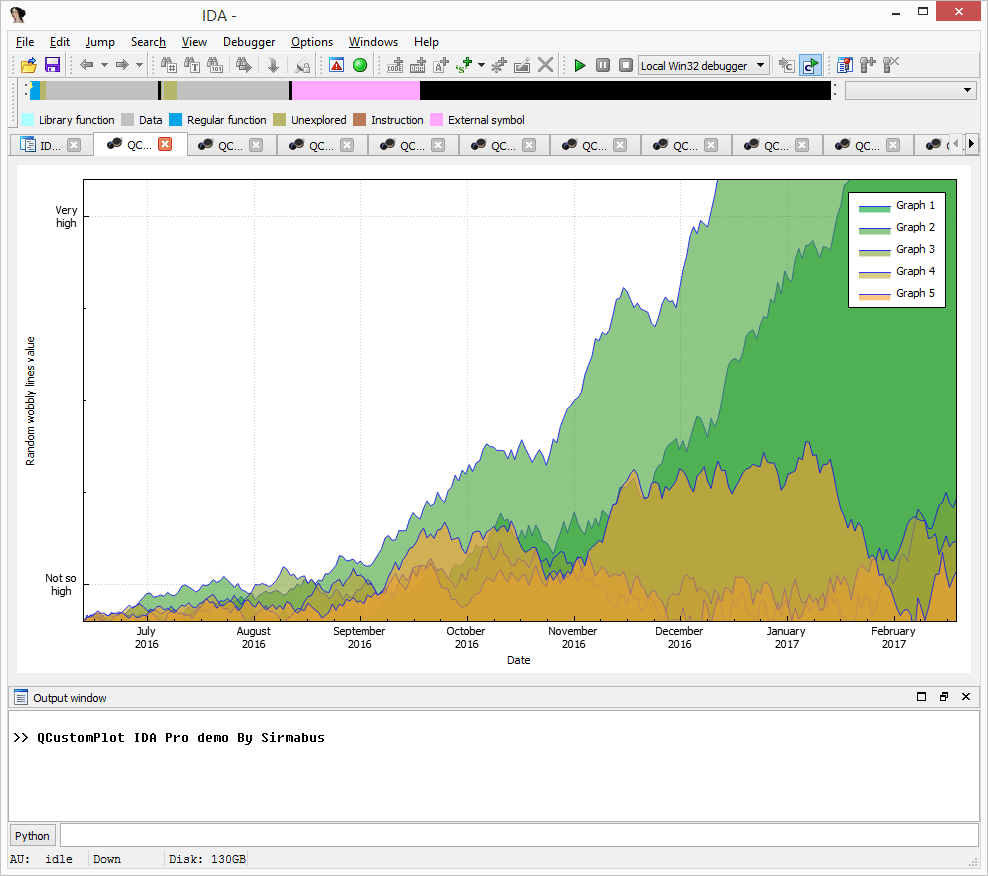
This is a rework of the QCustomPlot source “examples\plots” (in my project as “example plots”).
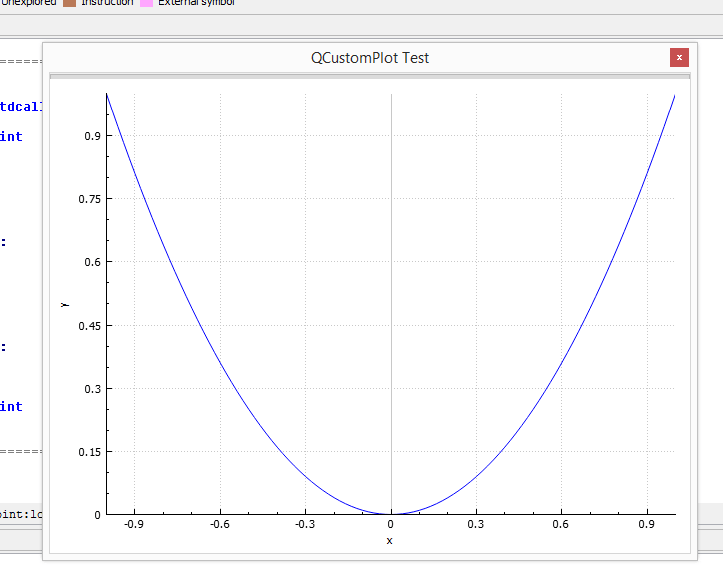
Single example undocked widow (my project “base example”):
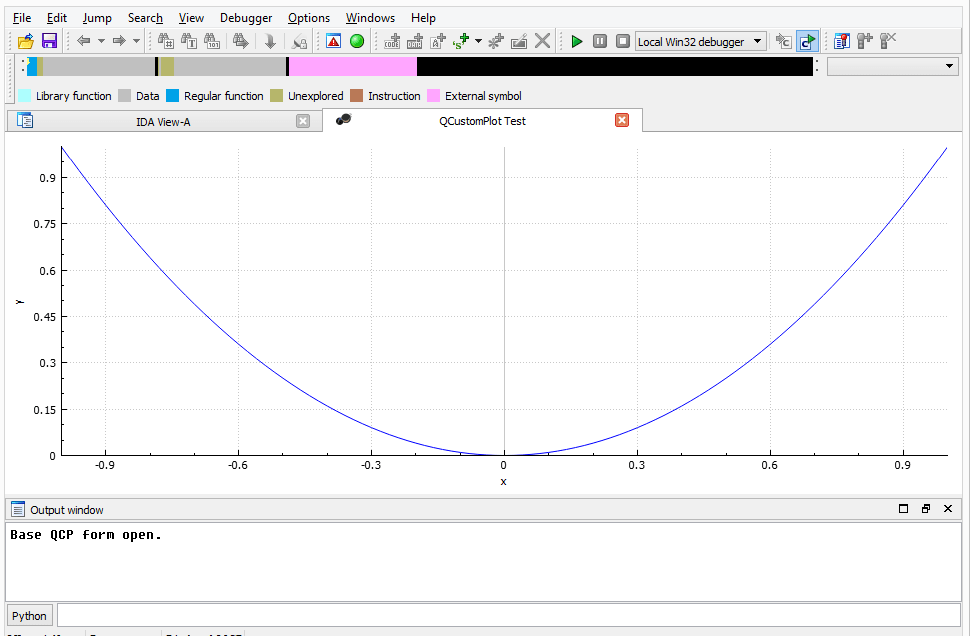
Sample as above, but now docked to IDA’s top area in a tab:
Looking at my code you’ll see I’m using a IDA SDK create_tform() and open_tform() to create the needed QWidget derived window. A UI callback to catch ui_tform_visible and ui_tform_visible events was required to properly maintain the creation and destroy phases of the window. This is all wrapped for ease of use in the simple idaqcp namespace.
Build notes:
There are some tricky caveats to build (using Visual Studio 2015). The use of Qt QPointers in the source causes some problems. Duplicate the properties from my demo projects carefully. In particular “$(QTDIR)\mkspecs\win32-msvc2013” must be added to “Additional Include Directories”, and the “-Zc:throwingNew” under C/C++ -> Command Line -> Additional Options. Without these you might get some strange low level results from the QPointer destructors. I wasn’t the first with this problem (a Qt, not an QCustomPlot issue) see here: Crash in QCustomPlot destructor.
See my blog post series on “Qt User Interfaces for IDA Pro C / C++” on how to setup an environment for using Qt in C/C++ IDA plug-ins.
While this solution works well for a binary plug-in it would probably be much easier to do this using Python.
Using IDA’s adapted PySide there are many Python plotting options like matplotlib, PyQtGraph, etc.
And while I’ll probably keep part of my plug-in still in C++ as an exporter to NumPy or something similar, I’ll want to switch to Python solution in the future as I dig deeper into my data analysis project(s).
Get this project here: https://sourceforge.net/projects/ida-qcustomplot/