It dawned on me the other day that because of how I think when I do reversing that seeing how many times a function is referenced would be useful information.
If I could just glean this off the screen rather then manually pressing ‘X’ and count summarizing each sub-function while within a function then that might save me a lot of time and energy.
As I am reversing a particular function it’s local functions are probably of more significance then ones that are not.
If I see a count of ‘1’ then I can assume it is local (although this might not be 100% true as there could be some error in my IDB that is missing one or more references).
Otherwise if I see a function with many references then I can make some assumptions about it’s nature too.
Maybe it’s in a utility use?, if it has thousands of refs then maybe it’s an allocator, or..?
This is probably of more use for large executables as there is typically more relative chaos in code space compared to a smaller set.
Easier to wrap the head around a target containing a few thousand functions vrs ones with fifty thousand plus. Sort of the difference between looking at a lake vrs the Pacific Ocean.
But maybe still useful in the smaller case none the less.
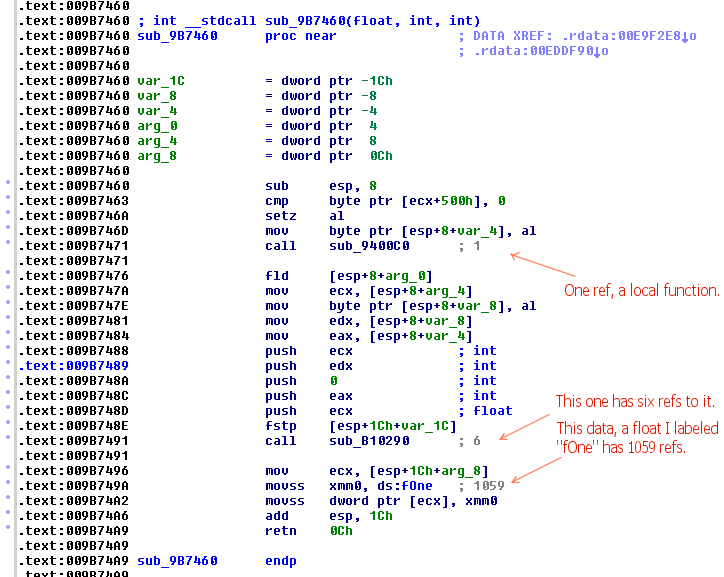
Example after counts applied:
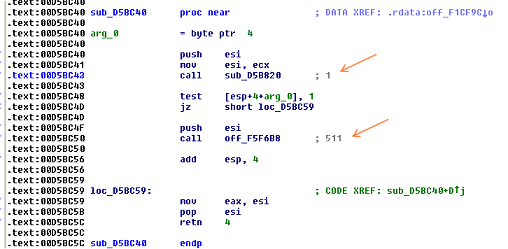
In this small function you can see the sub-function “sub_D5B820” is a local child function, while “off_F5F6B8” (actually a function pointer) has 511 references meaning it is not local and perhaps we can draw some inferences to it’s nature in the context of the target.
Now I could name the function “DoSomething_Func00” and the child “DoSomething_Func00_00” (in my own naming convention) and perhaps “pDoSomethingElse_Func00” for the other. Where do “DoSomething” is replaced with something more meaningful outside of an example of course.
Perhaps this information could be conveyed in some other fashion like coloring.
Example mockup:
Note this concept does nothing to encompass disconnected/unlinked function like C++ vftable member ones.
That would take some sort of dynamic run-time call tracing component and thoroughly exercising the target et al.
Anyhow only been playing with this idea a few days.
I made a plugin for this and if there is interest for it then I will release it.
Otherwise iterating through all IDB functions while counting all code “xrefs to” them and appending adding or prefixing them as comment is simple enough to do from a basic IDC or IDA Python script.
Available here:
Informational comment plug-ins